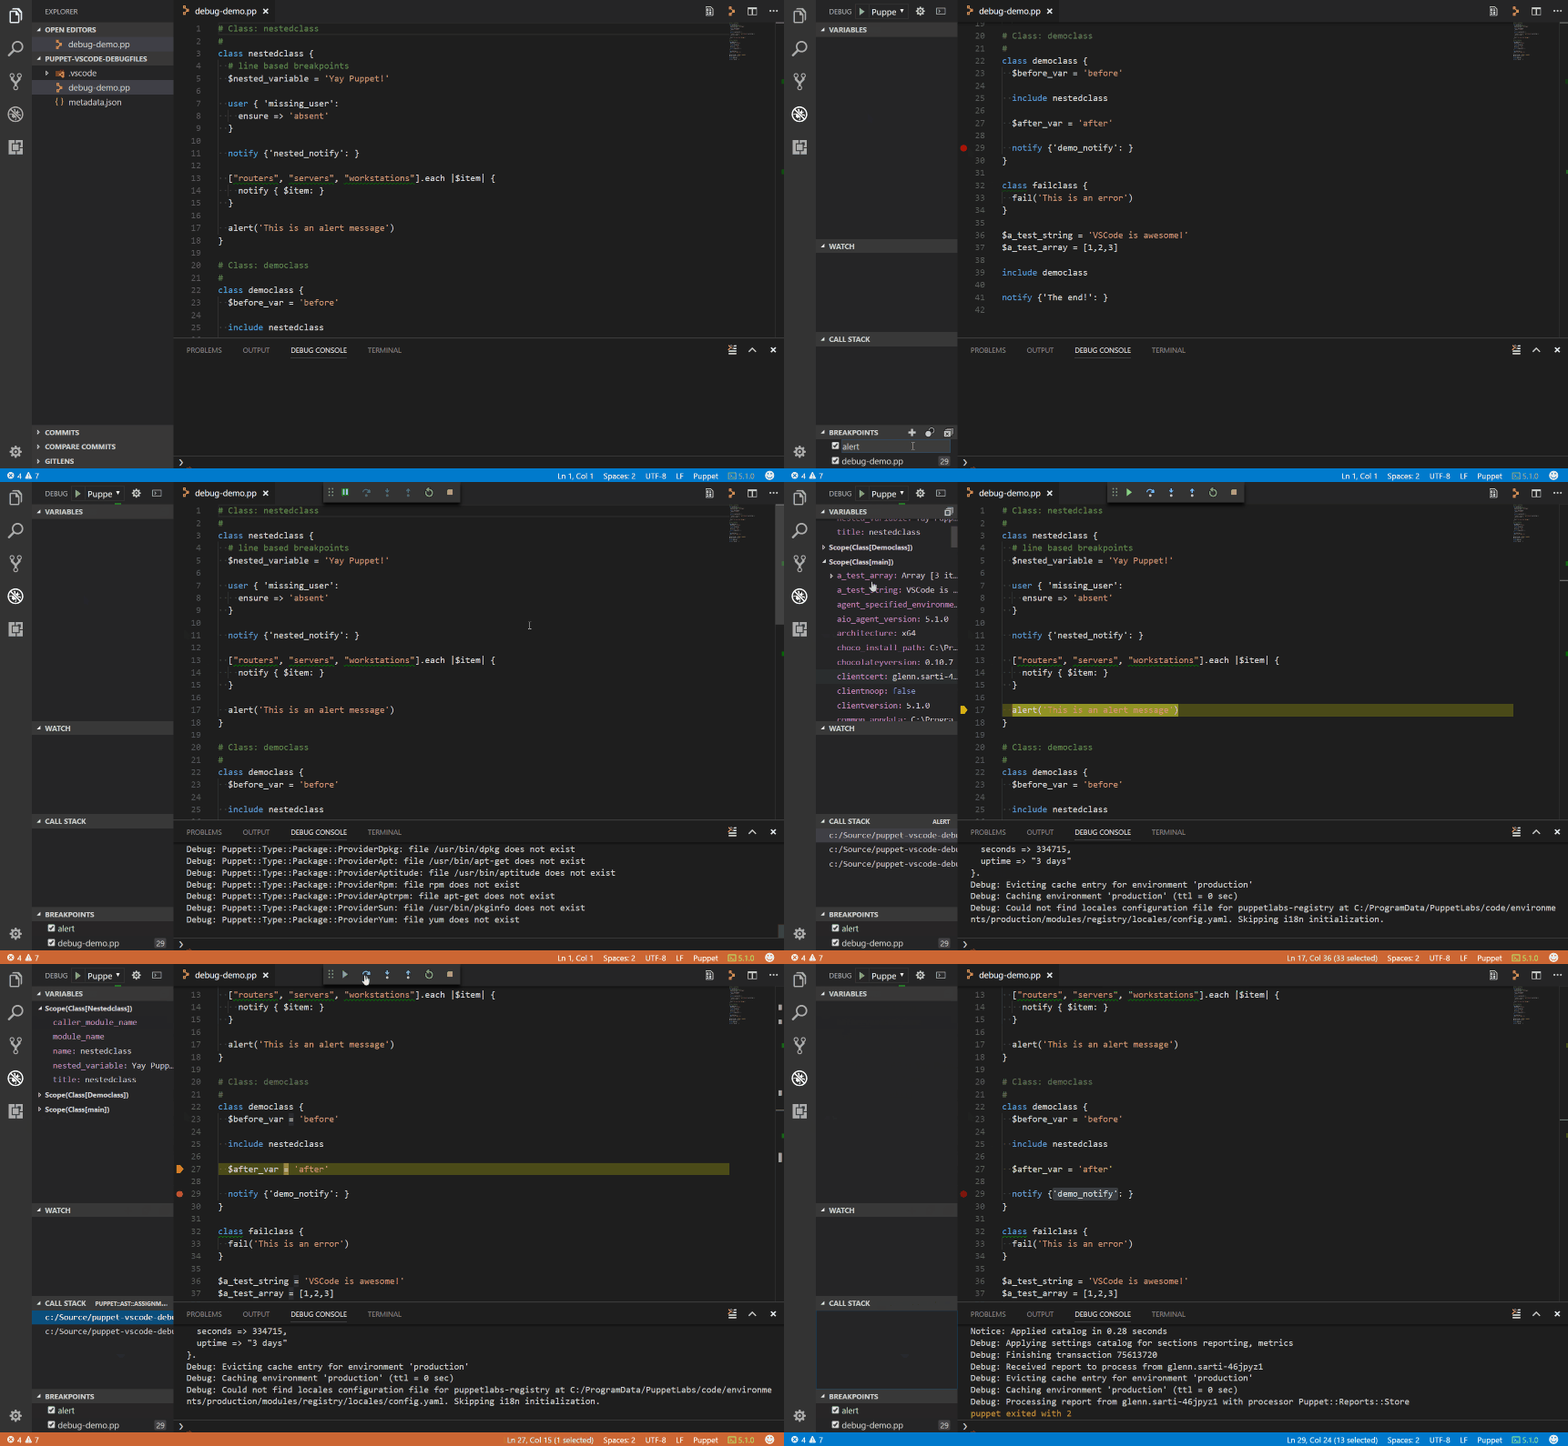
Debugging Puppet Code
The Puppet extension is able to debug the compilation of a Puppet manifest; much like the Go, PowerShell, and C# languages. The debugger supports:
- Line breakpoints but not conditions on those breakpoints
- Function breakpoints
- Exception breakpoints
- Call stack
- Variables, but only at the top stack frame
- Limited interactive debug console. For example, you can assign a variable a value, but just as in regular Puppet you can’t change its value later
- Step In, Out, and Over

The debugging features in the extension are based on the excellent ideas in puppet-debugger by Corey Osman.
Configuring the debug session
To debug a simple manifest in VS Code, press F5 and VS Code will try to debug your currently active manifest by running the equivalent of puppet apply. Note that by default No Operation (--noop) is enabled so that your local computer will not be modified.
The VSCode Debugging - Launch Configurations website has instructions on how to configure the debug session with more advanced options.
Settings
manifest- The manifest to apply. By default this is the currently open file in the editornoop- Whether thepuppet applysets No Operation (NoOp) mode. By default, this is set to true. This means when running the debugger it will not make changes to your system. The documentation about the puppet agent has more information aboutpuppet applyand and thenoopoption.args- Additional arguments to pass topuppet apply, for example['--debug']will output debug information